Skip to content
The picture shows a tablet PC with different diagrams displayed on it

FDZ in numbers

The bar chart shows the number of jobs via JoSuA by mode. The values are monthly data since October 2023 and are based on the FDZ's own calculations.
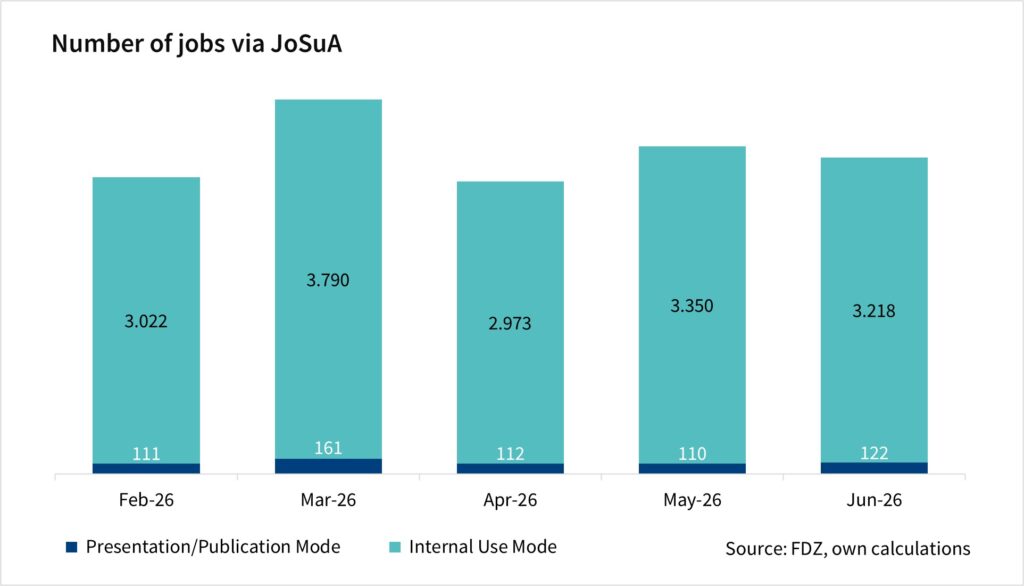
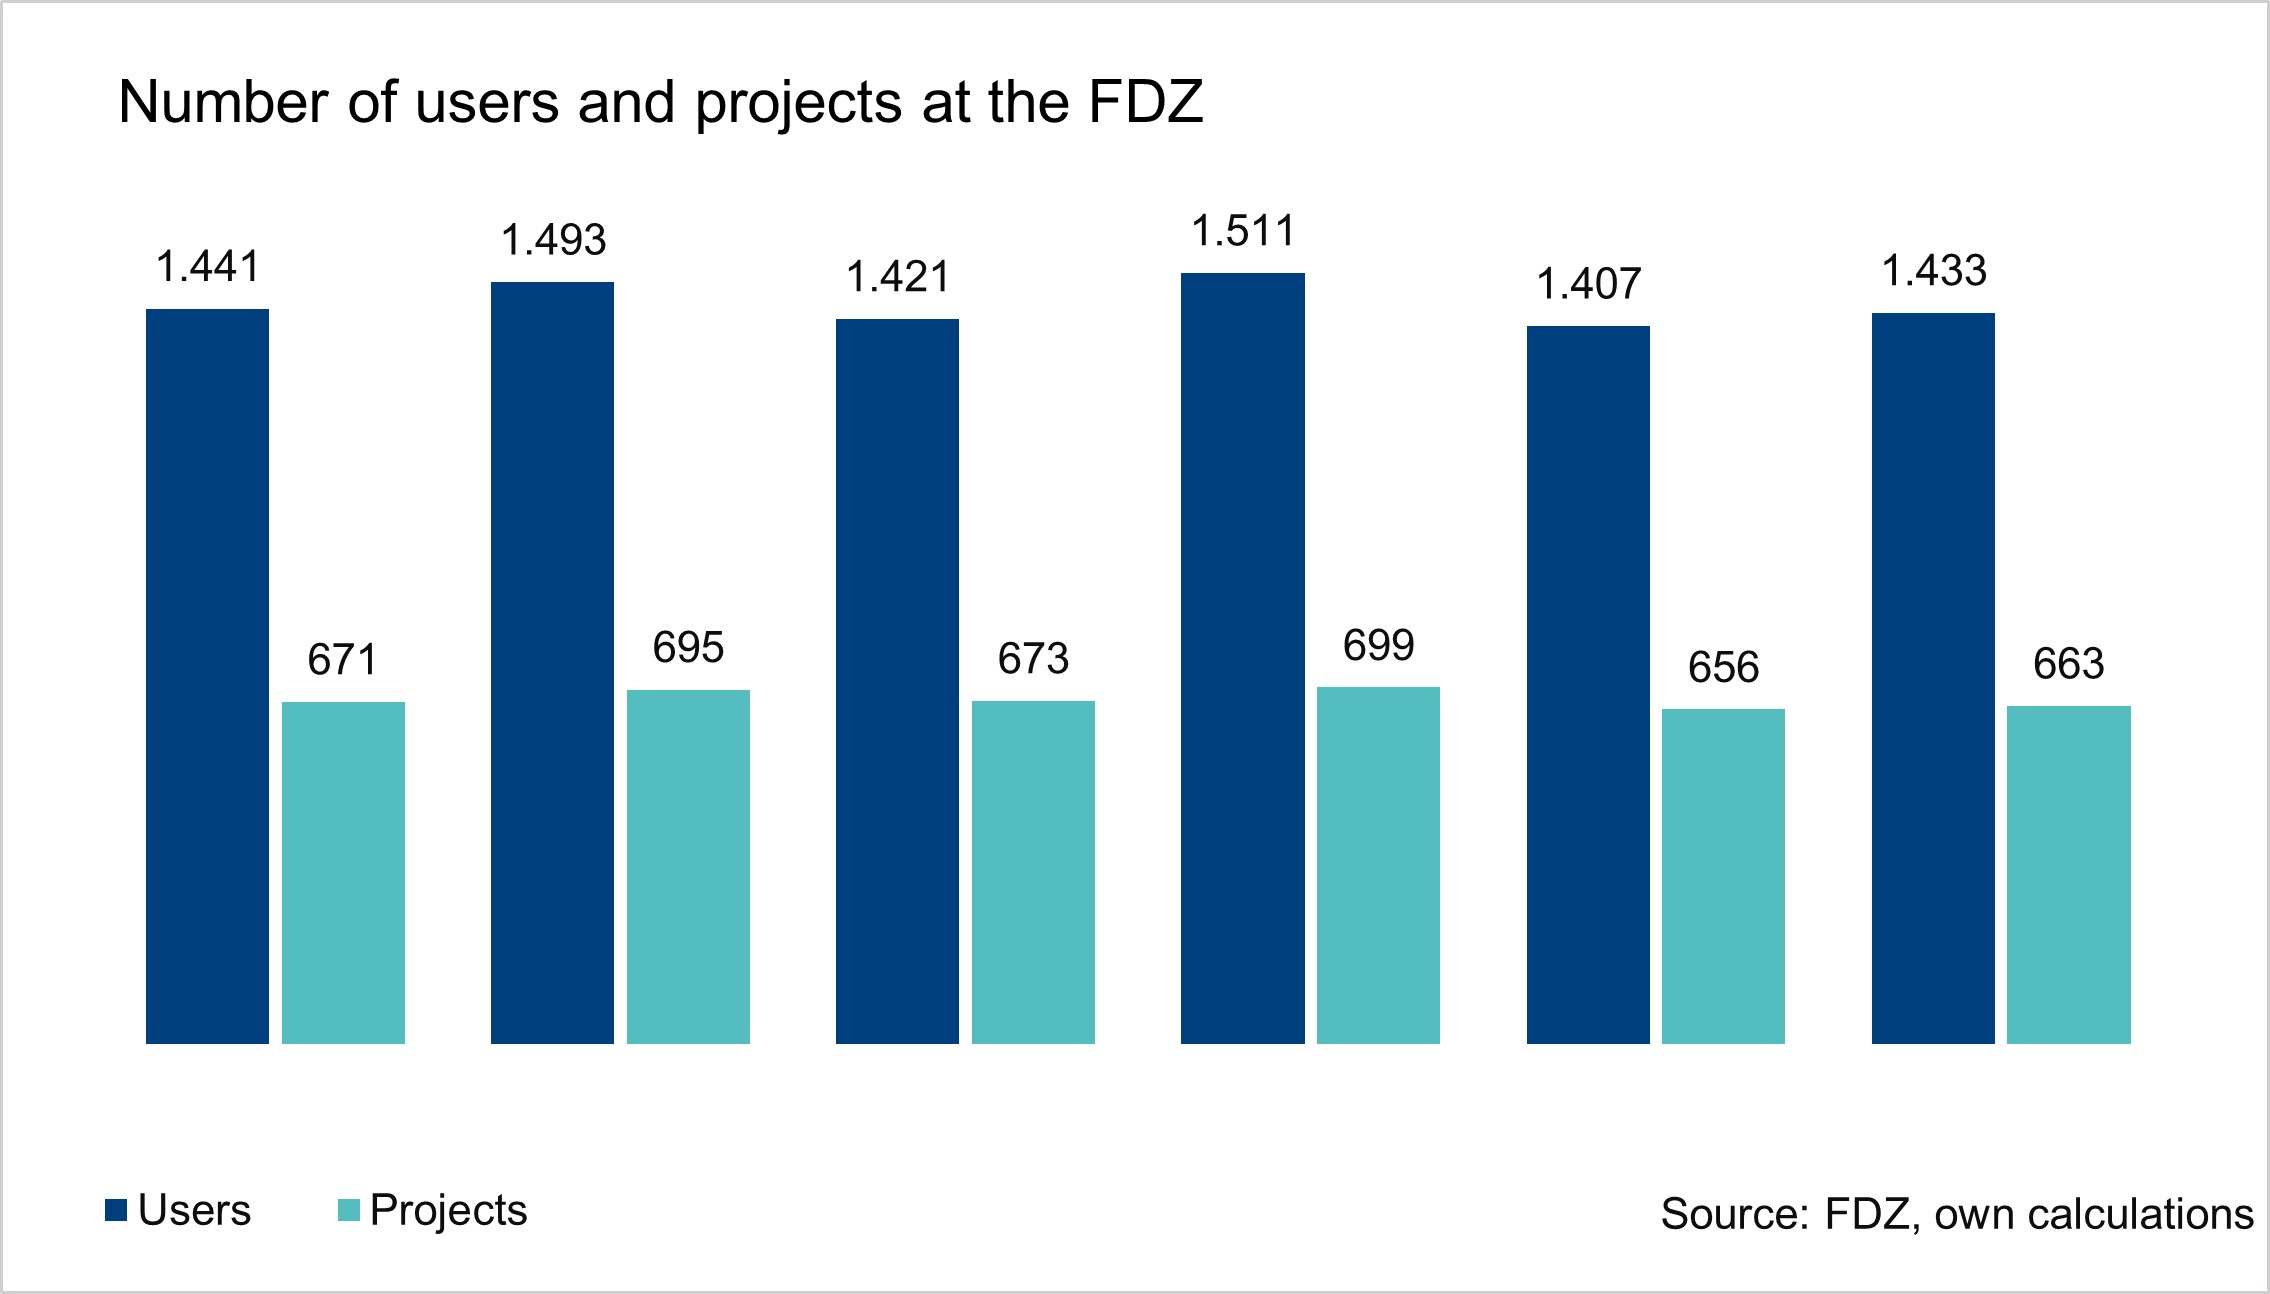
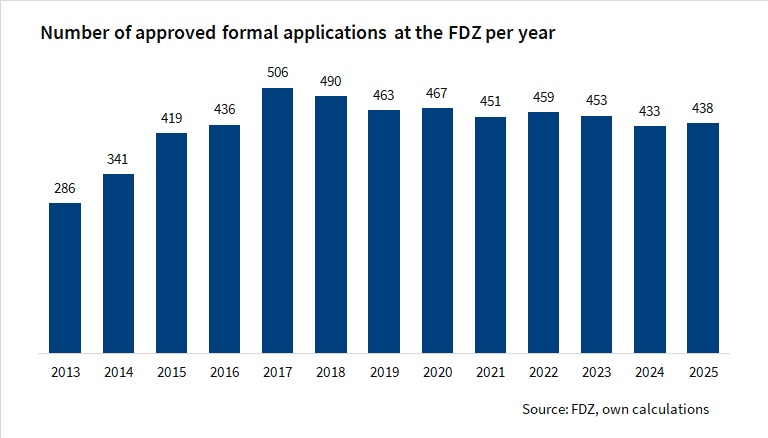
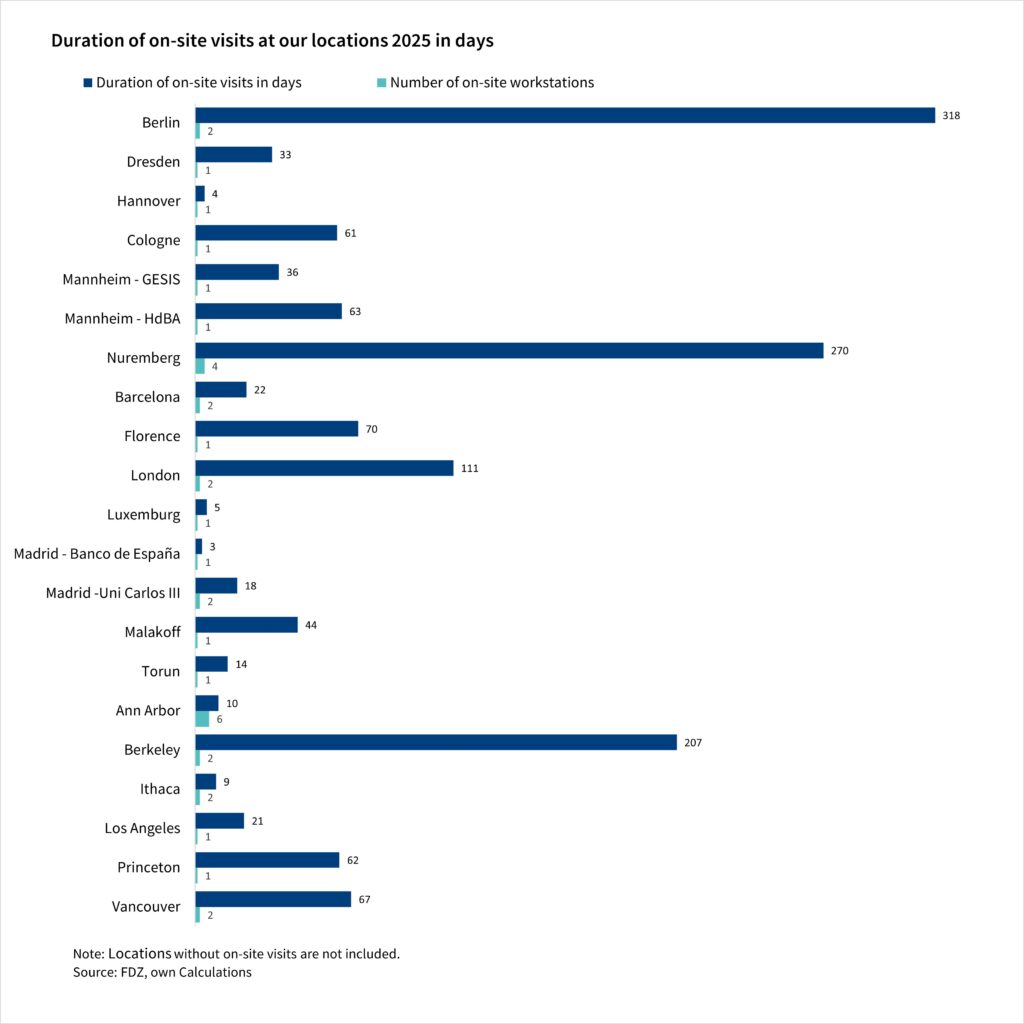
Fig. 1: Number of jobs via JoSuA
Table Fig. 1
The bar chart shows the number of users and projects at the FDZ (all users in all projects are counted). The values are semi-annual data for the last three years and are based on the FDZ's own calculations.
Fig. 2: Number of users and projects at the FDZ
(all users in all projects)
Table Fig. 2
The bar chart shows the number of approved, formal applications at the FDZ per year since 2013. The values are annual and are based on the FDZ's own calculations.
Fig. 3: Number of approved formal applications at the FDZ per year
Table Fig. 3
The bar chart shows the number and duration of on-site visits (in days) at our locations in 2023. The values are per location and are based on the FDZ's own calculations.
Fig. 4: Number and duration of on-site visits at our locations 2023 in days.
Table Fig. 4